/ November 2011 ~ Java EE Support Patterns

11.28.2011

java.lang.outofmemoryerror: Java heap space - Analysis and resolution approach

java.lang.OutOfMemoryError: Java heap problem is one of the most complex problems you can face when supporting or developing complex Java EE applications.

This article will provide you with a description of this JVM HotSpot OutOfMemoryError error message and how you should attack this problem until its resolution.

For a quick help guide on how to determine which type of OutOfMemoryError you are dealing with, please consult the related posts found in this Blog. You will also find tutorials on how to analyze a JVM Heap Dump and identify potential memory leaks. A troubleshooting guide video for beginners is also available from our YouTube channel.

java.lang.OutOfMemoryError: Java heap space – what is it?

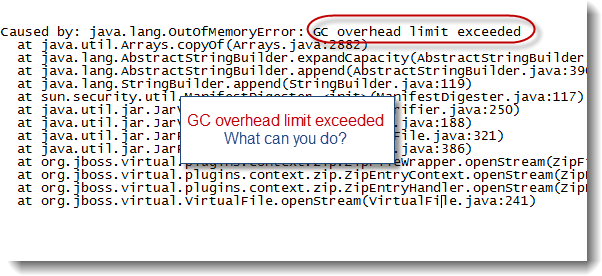
This error message is typically what you will see your middleware server logs (Weblogic, WAS, JBoss etc.) following a JVM OutOfMemoryError condition:

·         It is generated from the actual Java HotSpot VM native code
·         It is triggered as a result of Java Heap (Young Gen / Old Gen spaces) memory allocation failure (due to Java Heap exhaustion)

Find below a code snippet from the OpenJDK project source code exposing the JVM HotSpot implementation. The code is showing which condition is triggering the OutOfMemoryError: Java heap space condition.

# collectedHeap.inline.hpp


I strongly recommend that you download the HotSpot VM source code from OpenJDK yourself for your own benefit and future reference.

Ok, so my application Java Heap is exhausted…how can I monitor and track my application Java Heap?

The simplest way to properly monitor and track the memory footprint of your Java Heap spaces (Young Gen & Old Gen spaces) is to enable verbose GC from your HotSpot VM. Please simply add the following parameters within your JVM start-up arguments:

-verbose:gc –XX:+PrintGCDetails –XX:+PrintGCTimeStamps –Xloggc:<app path>/gc.log

You can also follow this tutorial  which will help you understand how to read and analyze your HotSpot Java Heap footprint.

Ok thanks, now I can see that I have a big Java Heap memory problem…but how can I fix it?

There are multiple scenarios which can lead to Java Heap depletion such as:

·         Java Heap space too small vs. your application traffic & footprint
·         Java Heap memory leak (OldGen space slowly growing over time…)
·         Sudden and / or rogue Thread(s) consuming large amount of memory in short amount of time etc.

Find below a list of high level steps you can follow in order to further troubleshoot:

·         If not done already, enabled verbose GC >> -verbose:gc
·         Analyze the verbose GC output and determine the memory footprint of the Java Heap for each of the Java Heap spaces (YoungGen & OldGen)
·         Analyze the verbose GC output or use a tool like JConsole to determine if your Java Heap is leaking over time. This can be observed via monitoring of the HotSpot old gen space.
·         Monitor your middleware Threads and generate JVM Thread Dumps on a regular basis, especially when a sudden increase of Java Heap utilization is observed. Thread Dump analysis will allow you to pinpoint potential long running Thread(s) allocating a lot of objects on your Java Heap in a short amount of time; if any
·         Add the following parameter within your JVM start-up arguments: -XX:HeapDumpOnOutOfMemoryError This will allow your HotSpot VM to generate a binary Heap Dump (HPROF) format. A binary Heap Dump is a critical data allowing to analyze your application memory footprint and / or source(s) of Java Heap memory leak

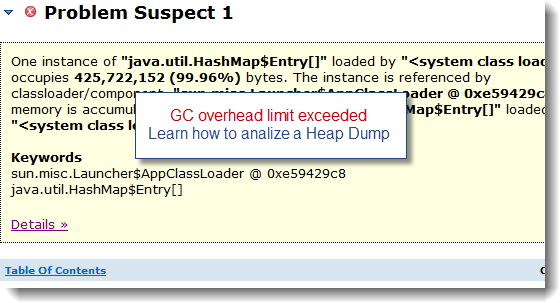
From a resolution perspective, my recommendation to you is to analyze your Java Heap memory footprint using the generated Heap Dump. The binary Heap Dump (HPROF format) can be analyzed using the free Memory Analyzer tool (MAT). This will allow you to understand your java application footprint and / or pinpoint source(s) of possible memory leak. Once you have a clear picture of the situation, you will be able to resolve your problem by increasing your Java Heap capacity (via –Xms & Xmx arguments) or reducing your application memory footprint and / or eliminating the memory leaks from your application code. Please note that memory leaks are often found in middleware server code and JDK as well.

I tried everything I could but I am still struggling to pinpoint the source of my OutOfMemoryError

Don’t worry, simply post a comment / question at the end of this article or email me directly @phcharbonneau@hotmail.com. I currently offer free IT / Java EE consulting. Please provide me with your problem description along you’re your generated data such as a download link to your Heap Dump, Thread Dump data, server logs etc. and I will analyze your problem for you.

11.24.2011

How to analyze Thread Dump – part 1

This article is part #1 of a series of posts that will teach you how to analyze a JVM Thread Dump and pinpoint the root cause of your problem(s). From my perspective, Thread Dump analysis is the most important skillset to master for any individual involved in Java EE production support. The amount of information that you can derive from Thread Dump snapshots is often much beyond than what you can think of.

My goal is to share with you my knowledge on Thread Dump analysis that I accumulated over the last 10 years e.g. hundreds of Thread Dump analysis cycles with dozens of common problem patterns across many JVM versions and JVM vendors.

Please bookmark this page and stay tuned for weekly articles.
Please also feel free to share this Thread Dump training plan with your work colleagues and friends.

** UPDATE: Thread Dump analysis tutorial videos now available here.

Sounds good, I really need to improve my Thread Dump skills… so where do we start?

What I’m proposing to you is a complete Thread Dump training plan. The following items will be covered. I will also provide you with real life Thread Dump examples that you can study and understand.


      1)      Thread Dump overview & fundamentals
      2)      Thread Dump generation techniques and available tools
      3)      Thread Dump format differences between Sun HotSpot, IBM JRE and Oracle JRockit
      4)      Thread Stack Trace explanation and interpretation
      5)      Thread Dump analysis and correlation techniques
      6)      Thread Dump common problem patterns (Thread race, deadlock, hanging IO calls, garbage collection / OutOfMemoryError problems, infinite looping etc.)
      7)      Thread Dump examples via real life case studies

I really hope this Thread Dump analysis training plan will be beneficial for you so please stay tuned for weekly updates and articles!

But what if I still have questions or still struggling to understand these training articles?

Don’t worry and please consider me as your trainer. I strongly encourage you to ask me any question on Thread Dump (remember, there are no stupid questions) so I propose the following options to you for free; simply chose the communication model that you are more comfortable with:

      1)      Submit your Thread Dump related question(s) by posting your comment(s) below the article (please feel free to remain Anonymous)
      2)      Submit your Thread Dump data to the Root Cause Analysis forum
      3)      Email me your Thread Dump related question(s) @phcharbonneau@hotmail.com

Can I send you my Thread Dump data from my production environment / servers?

Yes, please feel free to send me your generated Thread Dump data via email or Root Cause Analysis forum if you wish to discuss the root cause of your problem(s). Real life Thread Dump analysis is always the best way to learn.

I really hope that you will enjoy and share this Thread Dump analysis training plan. I will do my very best to provide you with quality material and answers to any question.

You can now jump to the part 2 of the series (JVM Overview)
http://javaeesupportpatterns.blogspot.com/2012/01/how-to-analyze-thread-dump-part2-jvm.html

11.18.2011

java.lang.OutOfMemoryError – Weblogic Session size too big

A major problem was brought to our attention recently following a migration of a Java EE Portal application from Weblogic 8.1 to Weblogic 11g.

This case study will demonstrate how you can analyze an IBM JRE Heap Dump (.phd format) in order to determine the memory footprint of your application HttpSession objects.

Environment specifications (case study)

-         Java EE server: Oracle Weblogic Server 11g
-         Middleware OS: AIX 5.3
-         Java VM: IBM JRE 1.6.0
-         Platform type: Portal application

Monitoring and troubleshooting tools

-         Memory Analyzer 1.1 via IBM support assistant (IBM  JRE Heap Dump analysis)

Step #1 – Heap Dump generation

A Heap Dump file was generated following an OutOfMemoryError. The IBM JRE Heap Dump format is as per below (phd extension stands for Portal Heap Dump).

* Please note that you can also manually generate a IBM JRE Heap Dump by either using dumpHeap JMX operation via JConsole or by adding IBM_HEAPDUMP=true in your Java environment variables along with kill –QUIT command *

// Portal Heap Dump generated on 2011-09-22
heapdump.20110922.003510.1028306.0007.phd

Step #2 – Load the Heap Dump file in MAT

We used the Memory Analyzer (MAT) tool from IBM Support Assistant in order to load our generated Heap Dump. The Heap Dump parsing process can take quite some time. Once the processing is completed, you will be able to see a Java Heap overview along with a Leak Suspect report.


Step #3 – Locate the Weblogic Session Data objects

In order to understand the runtime footprint of your application HttpSession (user session) objects, you first need to locate the Weblogic HttpSession internal data structure. Such internal data structured with using memory Session persistence is identified as:

weblogic.servlet.internal.session.MemorySessionData

Unless these objects are showing up from the Leak Suspects report, the best way to locate them is to simply load the Histogram as per below and sort the Class Names. You should be able to easily locate the MemorySessionData class name and determine how many Objects instances. 1 instance of MemorySessionData corresponds to one user session of one of your Java EE Web Application.


Step #4 – HttpSession memory footprint analysis

It is now time to analyze the memory footprint of each of your HttpSession data. Simply right click on your mouse over weblogic.servlet.internal.session.MemorySessionData
 and select: List objects > with incoming references


For our case study, large HttpSession (MemorySessionData) objects were found using up to 52 MB for a single session objects which did explain why our Java Heap was depleted under heavy load.

At this point, you can explore the Session data object dig within a single instance of MemorySessionData. This will allow you to look at all your application Session data attributes and determine the source(s) of memory allocation. Simply select right click on one MemorySessionData and select >> List objects > with outgoing references.


Using this approach, our development team was able to identify the source of high memory allocation within our application HttpSession data and fix the problem.

Conclusion

I hope this tutorial along with our case study has helped you understand how useful and powerful a Heap Dump analysis can be in order to understand and identify your application HttpSession memory footprint.

Please don’t hesitate to post any comment or question.

11.07.2011

HashMap Thread safe problem – Case Study

This article will provide you with complete root cause analysis and solution of a java.util.HashMap Thread race condition affecting a Weblogic 10 Portal application.

This case study will also demonstrate how you can combine Solaris PRSTAT and Thread Dump analysis to pinpoint you top CPU contributor Threads within your Java VM(s).

Environment specifications

-         Java EE server: Oracle Weblogic Portal 10
-         Middleware OS: Solaris 10
-         Java VM: Oracle Jrockit 1.5.0
-         Platform type: Portal application

Monitoring and troubleshooting tools

-         Compuware Server Vantage (OS & Server level monitoring agent)
-         Solaris PRSTAT (CPU and Thread breakdown command)
-         JVM Thread Dump (thread analysis and PRSTAT data corrleation)

Problem overview

-         Problem type: Intermittent High CPU observed from our production environment

A high CPU problem was observed from Solaris server hosting a Weblogic portal 10 application.

Gathering and validation of facts

As usual, a Java EE problem investigation requires gathering of technical and non technical facts so we can either derived other facts and/or conclude on the root cause. Before applying a corrective measure, the facts below were verified in order to conclude on the root cause:

·        What is the client impact? MEDIUM
·        Recent change of the affected platform? No
·        Any recent traffic increase to the affected platform? No, traffic also appears to be fairly well distributed across all Weblogic managed servers / JVM
·        Since how long this problem has been observed?  A sudden CPU increase was observed from one of our JVM
·        Is the CPU problem global or isolated? A high CPU utilization was only observed from one JVM (60%+ for this Java process) but our other JVM’s are showing a healthy 5% average utilization

-         Conclusion #1: The high CPU problem appears to be isolated on one JVM only vs. a global problem

CPU utilization analysis

Review of the Compuware Server Vantage CPU data div reveal a sharp and sudden increase of CPU from one of our 4 JVM running our Weblogic 10 portal application e.g. 60%+ with no sign of CPU going down e.g. sustained high CPU utilization.

Java process CPU breakdown by Thread

One of the best troubleshooting approaches to deal with this type of issue is to generate a PRSTAT snapshot (if using Solaris OS) combined with Thread Dump. This is achieved by executing the command below:

prstat -L 0 1 | grep <Java PID>;kill -3 <Java PID>

For our case study, the following PRSTAT output data was generated as per below:

bash-2.05$ prstat -L 0 1 | grep 13853
 13853 bea  9982M 9909M cpu100   0    0   8:48:41 5.9% java/90
 13853 bea  9982M 9909M cpu1     0    0   2:49:10 5.9% java/91
 13853 bea  9982M 9909M cpu98    0    0   8:37:40 5.9% java/85
 13853 bea  9982M 9909M cpu101   0    0   2:50:21 5.9% java/88
 13853 bea  9982M 9909M cpu103   0    0   1:04:24 5.9% java/28
 13853 bea  9982M 9909M cpu102   0    0   4:52:06 5.8% java/94
 13853 bea  9982M 9909M cpu6     0    0   4:50:04 5.8% java/32
 13853 bea  9982M 9909M sleep   40    0   0:01:11 1.2% java/12289
 13853 bea  9982M 9909M sleep   59    0   0:05:36 1.1% java/89
 13853 bea  9982M 9909M sleep   30    0   0:19:17 0.7% java/62
 13853 bea  9982M 9909M sleep   40    0   0:05:54 0.7% java/93

As you can see in the above snapshot, several Threads were found taking ~ 6% each, ultimately contributing to this total ~ 50-60% CPU.

Such Threads found were: 90, 91, 85, 88, 28, 94, 32

Thread Dump analysis and PRSTAT correlation

Once you obtain a list of the culprit Threads consuming lot of your CPU, the next step is to correlate this data with the Thread Dump data and identify the source / culprit at the code level.

For a JRockit VM Thread Dump, the PRSTAT Thread id corresponds exactly to the decimal format of the Thread dump tid field which is located at the first line of each Thread.

For our case study, Thread Dump was generated which did reveal the culprit Threads as per below.
Thread #90 Stack Trace can be found below:

"[STUCK] ExecuteThread: '13' for queue: 'weblogic.kernel.Default (self-tuning)'" id=81 idx=0x168 tid=90 prio=1 alive, daemon
    at java/util/HashMap.put(HashMap.java:1665)
    at <App>.execute()
    ............................................
    at weblogic/servlet/internal/WebAppServletContext$ServletInvocationAction.run(WebAppServletContext.java:3393)
    at weblogic/security/acl/internal/AuthenticatedSubject.doAs(AuthenticatedSubject.java:321)
    at weblogic/security/service/SecurityManager.runAs(Lweblogic/security/acl/internal/AuthenticatedSubject;(Unknown Source)
    at weblogic/servlet/internal/WebAppServletContext.securedExecute(WebAppServletContext.java:2140)
    at weblogic/servlet/internal/WebAppServletContext.execute(WebAppServletContext.java:2046)
    at weblogic/servlet/internal/ServletRequestImpl.run(ServletRequestImpl.java:1366)
    at weblogic/work/ExecuteThread.execute(ExecuteThread.java:200)
    at weblogic/work/ExecuteThread.run(ExecuteThread.java:172)
    at jrockit/vm/RNI.c2java(JJJJJ)V(Native Method)
    -- end of trace

Thread Dump analysis – HashMap Thread Race condition!

As you can see from the above Thread Stack Trace of Thread #90, the Thread is currently stuck in an infinite loop / Thread race condition over a java.util.HashMap object. This finding was quite interesting.

All other Threads were also found at the exact same hanging condition which did confirm the Thread race condition against this application HashMap.

Root cause: non Thread safe HashMap!

A review of our application code which is creating & managing read and write operations of this HashMap did confirm that this HashMap was static and not Thread safe e.g. no synchronization for write operations and no usage of Collections.synchronizedMap().

As you may know, a HashMap by default is not Thread safe. This means that it is exposed to Thread race condition executing read and especially write operations. As per our case study, such non Thread safe HashMap, under high concurrent load, can lead to intermittent but severe Thread race condition, infinite looping and high CPU.

Solution: ConcurrentHashMap!

The solution to this problem did involve a replacement of the original non Thread Safe HashMap code implementation to a java.util.concurrent.ConcurrentHashMap.

For high concurrent Thread processing data structure, a ConcurrentHashMap is more applicable since it does provide you with Thread safe operations and non-blocking get operations e.g. get() operations may overlap with update operations (including put and remove).

This implementation strategy did eliminate 100% of the observed Thread Race conditions and at no noticeable performance impact.

Conclusion

I hope this case study has helped you understand how to pinpoint culprit of high CPU Threads at the code level and the importance of proper Thread safe data structure for high concurrent Thread / processing applications.
Please don’t hesitate to post any comment or question.

11.05.2011

Memory Analyzer download

Memory Analyzer (MAT) is an extremely useful tool that analyzes Java Heap Dump files with hundreds of millions of objects, quickly calculate the retained sizes of objects, see who is preventing the Garbage Collector from collecting objects, run a report to automatically extract leak suspects.

Why do I need it?

OutOfMemoryError problems are quite complex and require proper analysis. The tool is a must for any Java EE production support person or developer who requires to investigate memory leak and / or to analyze their application memory footprint.

Where can I find tutorials and case studies?

You will find from this Blog several case studies and tutorial on how to use this tool to pinpoint Java Heap memory leaks. Find below a few examples:

http://javaeesupportpatterns.blogspot.com/2011/09/gc-overhead-limit-exceeded-java-heap.html
http://javaeesupportpatterns.blogspot.com/2011/02/ibm-sdk-heap-dump-httpsession-footprint.html

Where can I download it?

Memory Analyzer can be downloaded for free as a standalone software from the Eclipse site or integrated within the IBM Support Assistant tool.

## Eclipse MAT

## MAT via IBM Support Assistant tool (select Memory Analyzer from the Tools add-ons)

HPROF – Memory leak analysis tutorial

This article will provide you with a tutorial on how you can analyze a JVM memory leak problem by generating and analyzing a Sun HotSpot JVM HPROF Heap Dump file.

A real life case study will be used for that purpose: Weblogic 9.2 memory leak affecting the Weblogic Admin server.

Environment specifications

·         Java EE server: Oracle Weblogic Server 9.2 MP1
·         Middleware OS: Solaris 10
·         Java VM: Sun HotSpot 1.5.0_22
·         Platform type: Middle tier

Monitoring and troubleshooting tools

·         Quest Foglight (JVM and garbage collection monitoring)
·          jmap (hprof / Heap Dump generation tool)
·         Memory Analyzer 1.1 via IBM support assistant (hprof Heap Dump analysis)
·         Platform type: Middle tier

Step #1 – WLS 9.2 Admin server JVM monitoring and leak confirmation

The Quest Foglight Java EE monitoring tool was quite useful to identify a Java Heap leak from our Weblogic Admin server. As you can see below, the Java Heap memory is growing over time.

If you are not using any monitoring tool for your Weblogic environment, my recommendation to you is to at least enable verbose:gc of your HotSpot VM. Please visit my Java 7 verbose:gc tutorial on this subject for more detailed instructions.


Step #2 – Generate a Heap Dump from your leaking JVM

Following the discovery of a JVM memory leak, the goal is to generate a Heap Dump file (binary format) by using the Sun JDK jmap utility.

** please note that jmap Heap Dump generation will cause your JVM to become unresponsive so please ensure that no more traffic is sent to your affected / leaking JVM before running the jmap utility **

<JDK HOME>/bin/jmap -heap:format=b <Java VM PID>


This command will generate a Heap Dump binary file (heap.bin) of your leaking JVM. The size of the file and elapsed time of the generation process will depend of your JVM size and machine specifications / speed.

For our case study, a binary Heap Dump file of ~ 2 GB was generated in about 1 hour elapsed time.

Sun HotSpot 1.5/1.6/1.7 Heap Dump file will also be generated automatically as a result of a OutOfMemoryError and by adding -XX:+HeapDumpOnOutOfMemoryError in your JVM start-up arguments.


Step #3 – Load your Heap Dump file in Memory Analyzer tool

It is now time to load your Heap Dump file in the Memory Analyzer tool. The loading process will take several minutes depending of the size of your Heap Dump and speed of your machine.


Step #4 – Analyze your Heap Dump

The Memory Analyzer provides you with many features, including a Leak Suspect report. For this case study, the Java Heap histogram was used as a starting point to analyze the leaking objects and the source.


For our case study, java.lang.String and char[] data were found as the leaking Objects. Now question is what is the source of the leak e.g. references of those leaking Objects. Simply right click over your leaking objects and select >> List Objects > with incoming references


As you can see, javax.management.ObjectName objects were found as the source of the leaking String & char[] data. The Weblogic Admin server is communicating and pulling stats from its managed servers via MBeans / JMX which create javax.management.ObjectName for any MBean object type. Now question is why Weblogic 9.2 is not releasing properly such Objects…

Root cause: Weblogic javax.management.ObjectName leak!

Following our Heap Dump analysis, a review of the Weblogic known issues was performed which did reveal the following Weblogic 9.2 bug below:

·         Weblogic Bug ID: CR327368
·         Description: Memory leak of javax.management.ObjectName objects on the Administration Server used to cause OutOfMemory error on the Administration Server.
·         Affected Weblogic version(s): WLS 9.2
·         Fixed in: WLS 10 MP1

 This finding was quite conclusive given the perfect match of our Heap Dump analysis, WLS version and this known problem description.

Conclusion

I hope this tutorial along with case study has helped you understand how you can pinpoint the source of a Java Heap leak using jmap and the Memory Analyzer tool.
Please don’t hesitate to post any comment or question.
I also provided free Java EE consultation so please simply email me and provide me with a download link of your Heap Dump file so I can analyze it for you and create an article on this Blog to describe your problem, root cause and resolution.